Blog
There is more of a focus on data science.
Latest Post
Server set up
Node.js probably needs no introduction but too bad it's getting one anyway. It's a very popular JavaScript runtime that's really good at sending data to a bunch of different devices. Go to their site to install it and create a directory where you want to start building your server. Then point your command line to your directory and type in npm install socket.io mysql express. Socket.io is the main framework that's used to send and receive data from the server to client and vice versa. Mysql is necessary to access the mysql database. Express basically just makes building a web app in node.js easier. You'll also need to enable port 8081 on your computer's firewall and port forward that port on your router's web interface. You can use any port that's not already being used but let's just use this one for this tutorial.
Anyway, that npm install socket.io mysql express command should have generated a folder called node_modules in your directory. Now create a new file in your project directory called main.js. Well you can call it whatever you want as long as it's a .js file. Now enter all this code in it:
  var http = require('http'); //needed to build a webserver in node
  var express = require('express'); //streamlines the process
  var mysql = require('mysql'); //needed to access database
  var app = express(); //creates express application
  var server = http.createServer(app); //creates the server
  var io = require('socket.io').listen(server); //needed to send data back and forth between server and clients
  server.listen(8081); //makes the server listen on port 8081
  console.log('Server running at 127.0.0.1:8081'); //just so you can see that it's running

  var pool = mysql.createPool({ //creates a pool of potential connections to the database
    connectionLimit : 100, //allows 100 different clients to connect at once
    host     : 'localhost', //the server hosting your database, in this case your local machine
    user     : 'root',
    password : '',
    database : 'testdb'
  });

  io.sockets.on('connection', function(socket){ //whenever a client connects
    socket.on('query', function(query){ //listen for the 'query' event from client
      var query = JSON.stringify(query); //convert the socket data object into a string
      pool.getConnection(function(err, connection){ //make a connection to the database
        connection.query(query, function(err, results){ //query the database
          if(err) {throw err;} //if there's an error, show it in the console
          else {socket.emit('results', results[0]);} //otherwise make the server emit a 'results' event that's carrying the result data (only take the first entry found)
        });
        connection.release(); //end connection
      });
    });
  });

  app.get('/', function(request, response){ //app does the following when a client goes to 127.0.0.1:8081/
    response.sendFile(path.join(__dirname + '/index.html')); //server sends the index.html to the client that requested it from the server
  });
HTML file
      <html>
      <head>
        <title>Access mysql server using node.js express and no PHP</title>
        <script src="https://ajax.googleapis.com/ajax/libs/jquery/1.11.2/jquery.min.js"></script>
        <script src="https://cdn.socket.io/socket.io-1.4.5.js"></script>
        <!-- need these for the client to be able to use jquery and socket.io -->
         <script type="text/javascript">
              $(document).ready(function () {
                // create new socket connection to your server
                var socket = io.connect('http://localhost:8081');
                // use jquery to listen for the submit button with the 'mysql-submit' id being clicked
                $('#mysql-submit').click(function () {
                  // when it's clicked, jquery grabs the text entered into the box
                  // with the 'mysql-query' id and the client emits a 'query' socket event
                  socket.emit('query', $('#mysql-query').val());
                });
                // whenever the server sends the client a 'query-results' event
                socket.on('query-results', function(results){
                  // place the result data into the div with class 'datadiv'
                  $('div.datadiv').text(JSON.stringify(results));
                });
              });

          </script>
      </head>
      <body>
        <div style="margin:100px;">
          <h2>Your data: </h2>
          <div class="datadiv"></div>
          <input id="mysql-query" type="text" value="Enter a query here"/>
          <input id="mysql-submit" type="submit" value="Submit"/>
        </div>
      </body>
      </html>
Creating the MySQL database
First you need to install MySQL. It should make you choose a username and password but I'll just assume you chose the default username 'root' and the default password ''. Once that's done, restart, then immediately go to your firewall and router web interface to port forward port 3306 (MySQL's default). Now your computer is a server and clients will be able to send MySQL queries to your computer through that port. In production you probably want to use a MySQL webhosting service because this makes your personal computer vulnerable to hackers. But don't worry about that for the purpose of this tutorial. Next, open up your command prompt again but this time it doesn't really matter where you do it. Type in:
mysql -u root -pcreate database testdb;use testdb;create table testtable (name varchar(20), number int);insert into testtable (name, number) values ("john", 3);Testing
Start your node.js server by going to your project directory in the command prompt and entering node main.js. Your MySQL server should be running already, but if it's not, type mysqld into a second command prompt. Now your webpage server and MySQL server should be running and be able to pass data through port 8081 and port 3306 respectively. Now type http://localhost:8081/ into your web browser address bar to access your website. Type select * from testtable; (or some other MySQL query) into the form you created and click the submit button. If your test data doesn't show up, send me an email and I'll figure out why.
Additional details explained
While the 'connection' socket event is a default event, the 'query' and 'results' events are not and their names are arbitrary and you must explicitly define them. This confused me for an embarassingly long time while I was learning to use socket.io.
This is just to use your site on your local machine. Enabling your web app to receive data from the outside world is a whole other headache.
There's tons of tutorials about using socket.io, mysql, and express, but none of them had all 3 of the following necessary components for what I was trying to make work: var server = http.createServer(app); var io = require('socket.io').listen(server); server.listen(8081); Whenever I followed other people's tutorials to the letter they didn't work for me. It took some trial and error to find this magic incantation so I figure might as well share it.
1/2/16
Exploratory data analysis
The first thing I had to do was familiarize myself with the database. To even do that in the first place I had to utilize the sqlite3 library. You might think the overview here would be enough, but no. By looking at actual sample chunks of the database I was able to determine that ups (upvotes) and score were identical, whereas the downs value was always 0. Because of this I couldn't get actual downvote data, so I had to use use "non-upvoted" (a score of 0 or 1) instead. I only used 500,000,000 data points for my analysis due to computational constraints.
Idea behind the algorithm
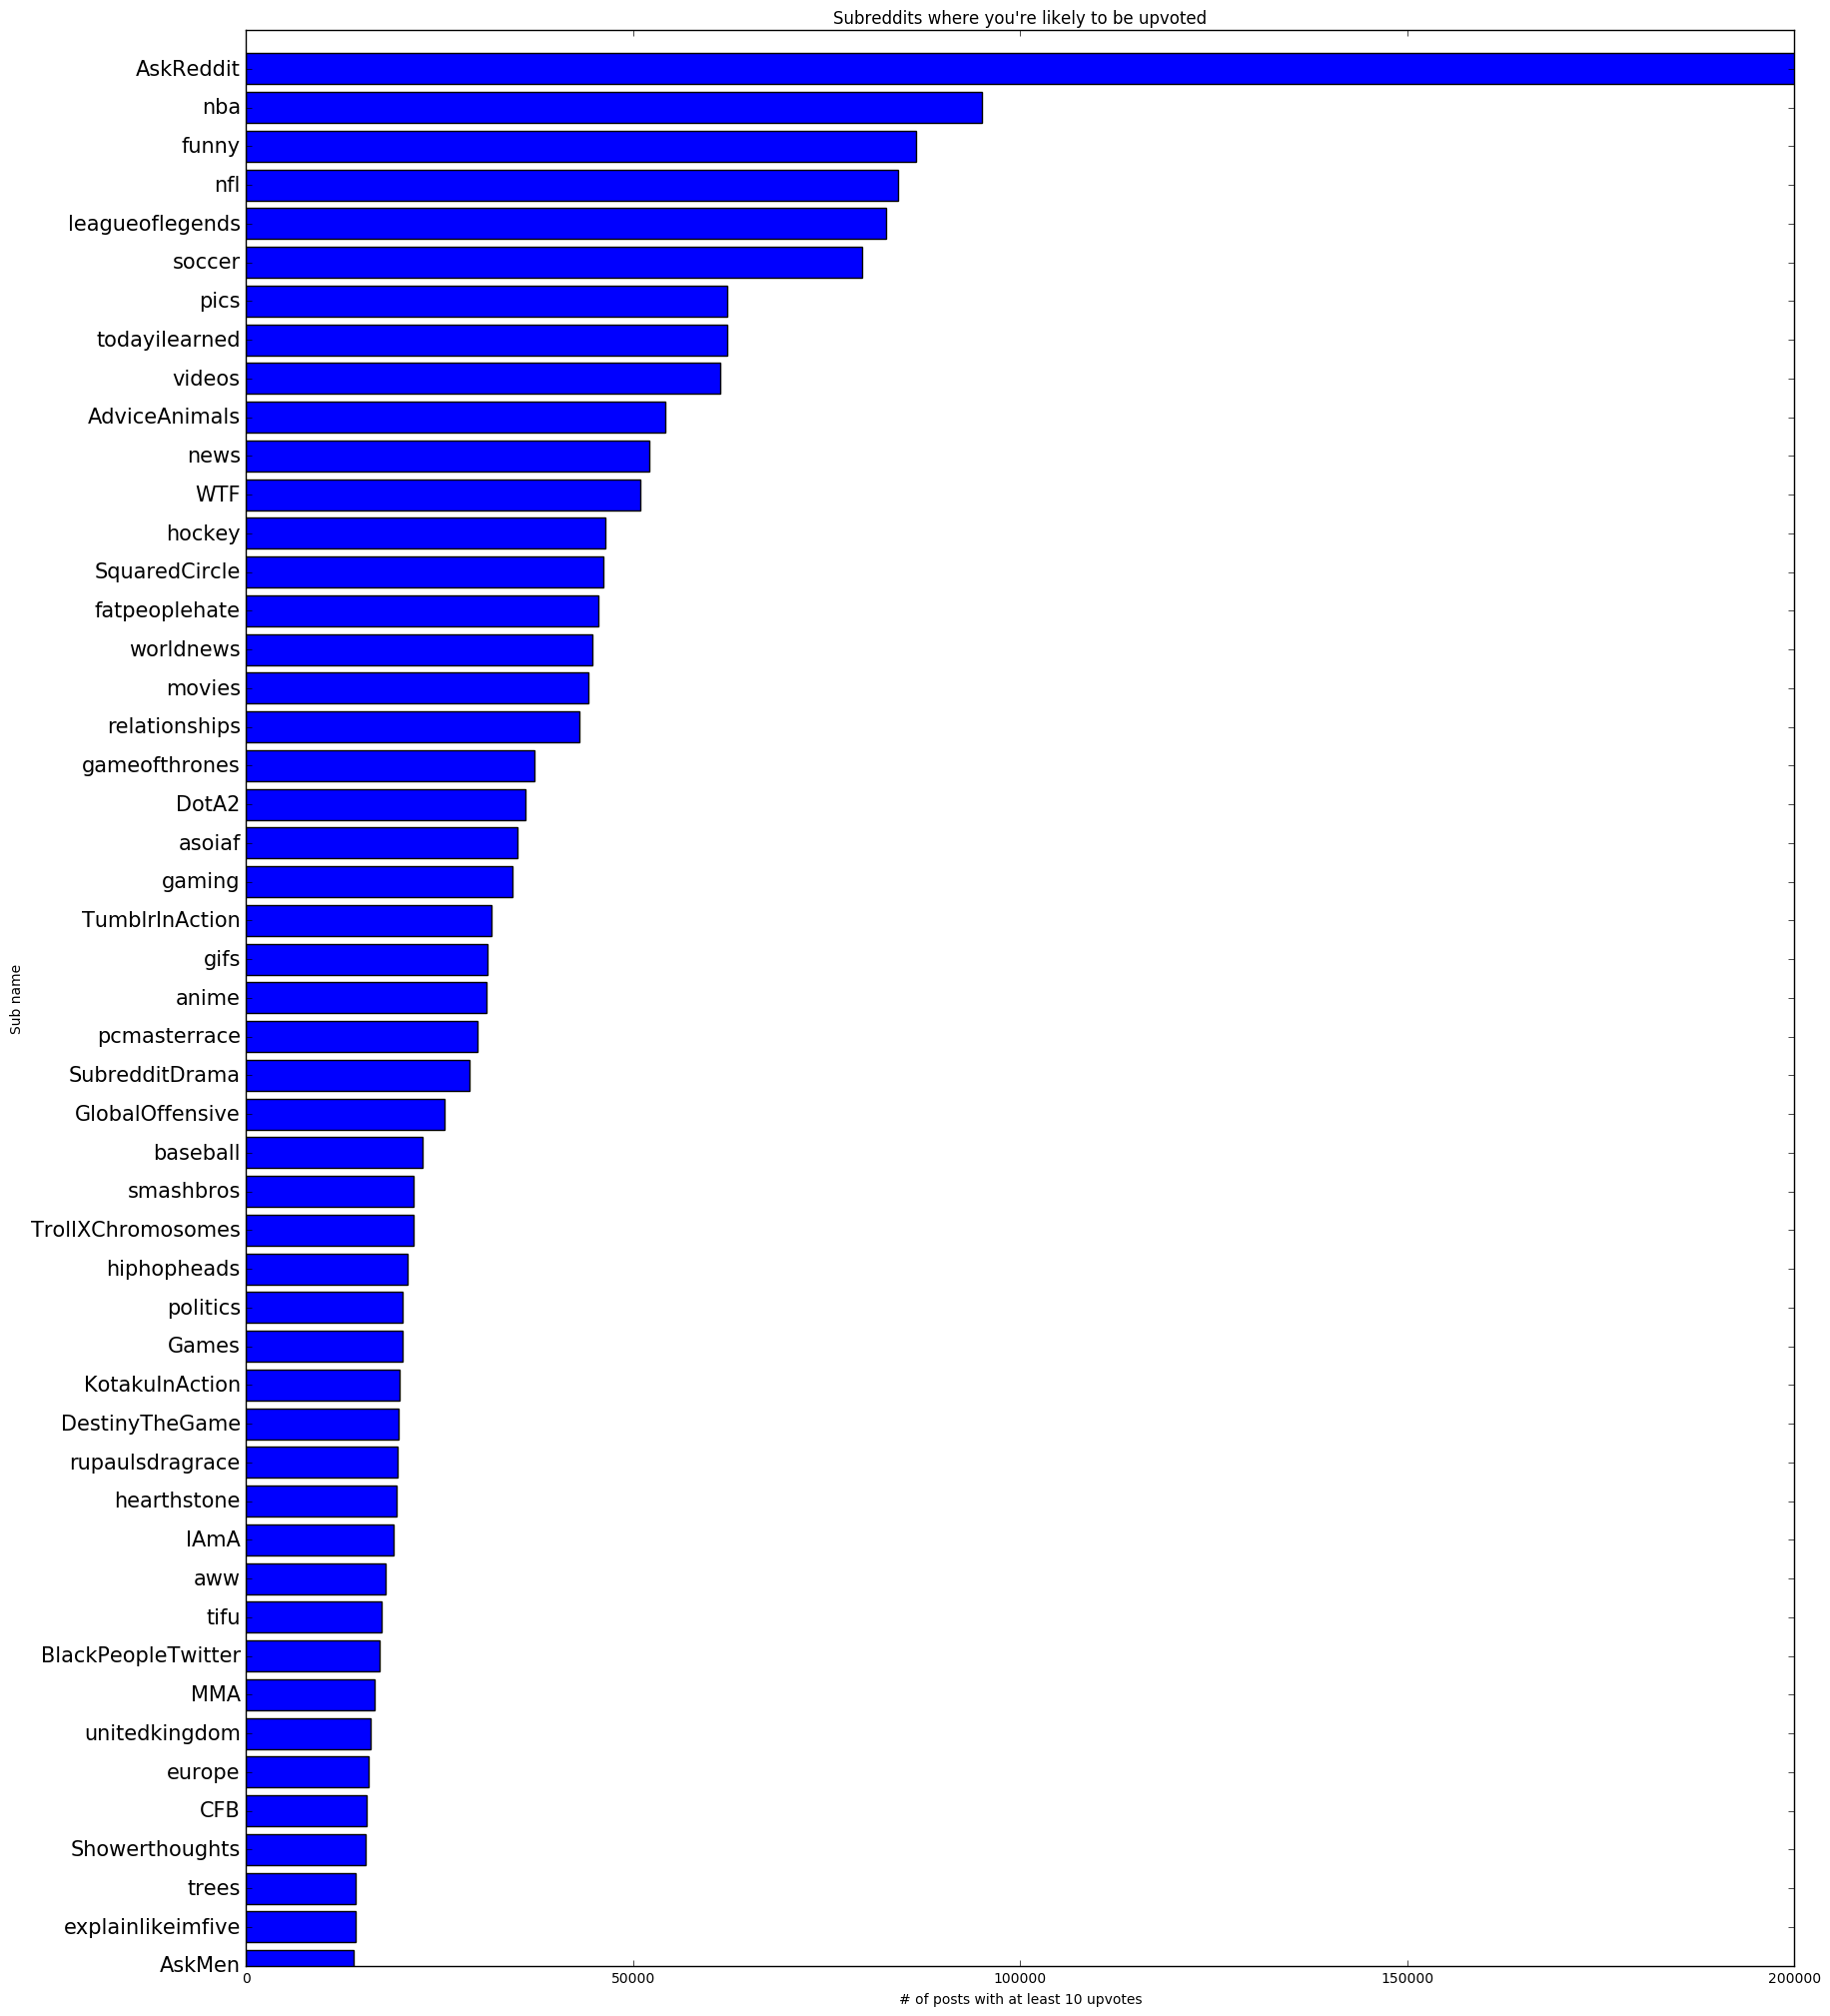
I tallied the number of comments in each subreddit with a score larger than 10. Why 10? Whenever I hit double digits on a reddit comment, I personally feel success (not so with a reddit post though). Why did I use a tally of the comments with 10+ upvotes rather than the number of upvotes per se? I wanted to capture a general upvoting behavior in my analysis while at the same time ignoring highly upvoted outliers. I also only retained data from subreddits with at least 5,000 comments that had 10+ upvotes. In addition to reducing the amount of data to be processed, the purpose of this was to filter out relatively inactive subreddits preventing them from distorting later upvote/non-upvote ratio analysis. In these small subreddits you'd likely get upvoted, but the net upvotes wouldn't be very high despite a high upvote/non-upvote ratio. A 5,000 upvoted comment threshold also seemed to be the sweet spot for the graph not changing too dramatically (I experimented in intervals of 500 all the way up to 10,000). For 10+ upvoted posts this yielded a graph that looked like this:
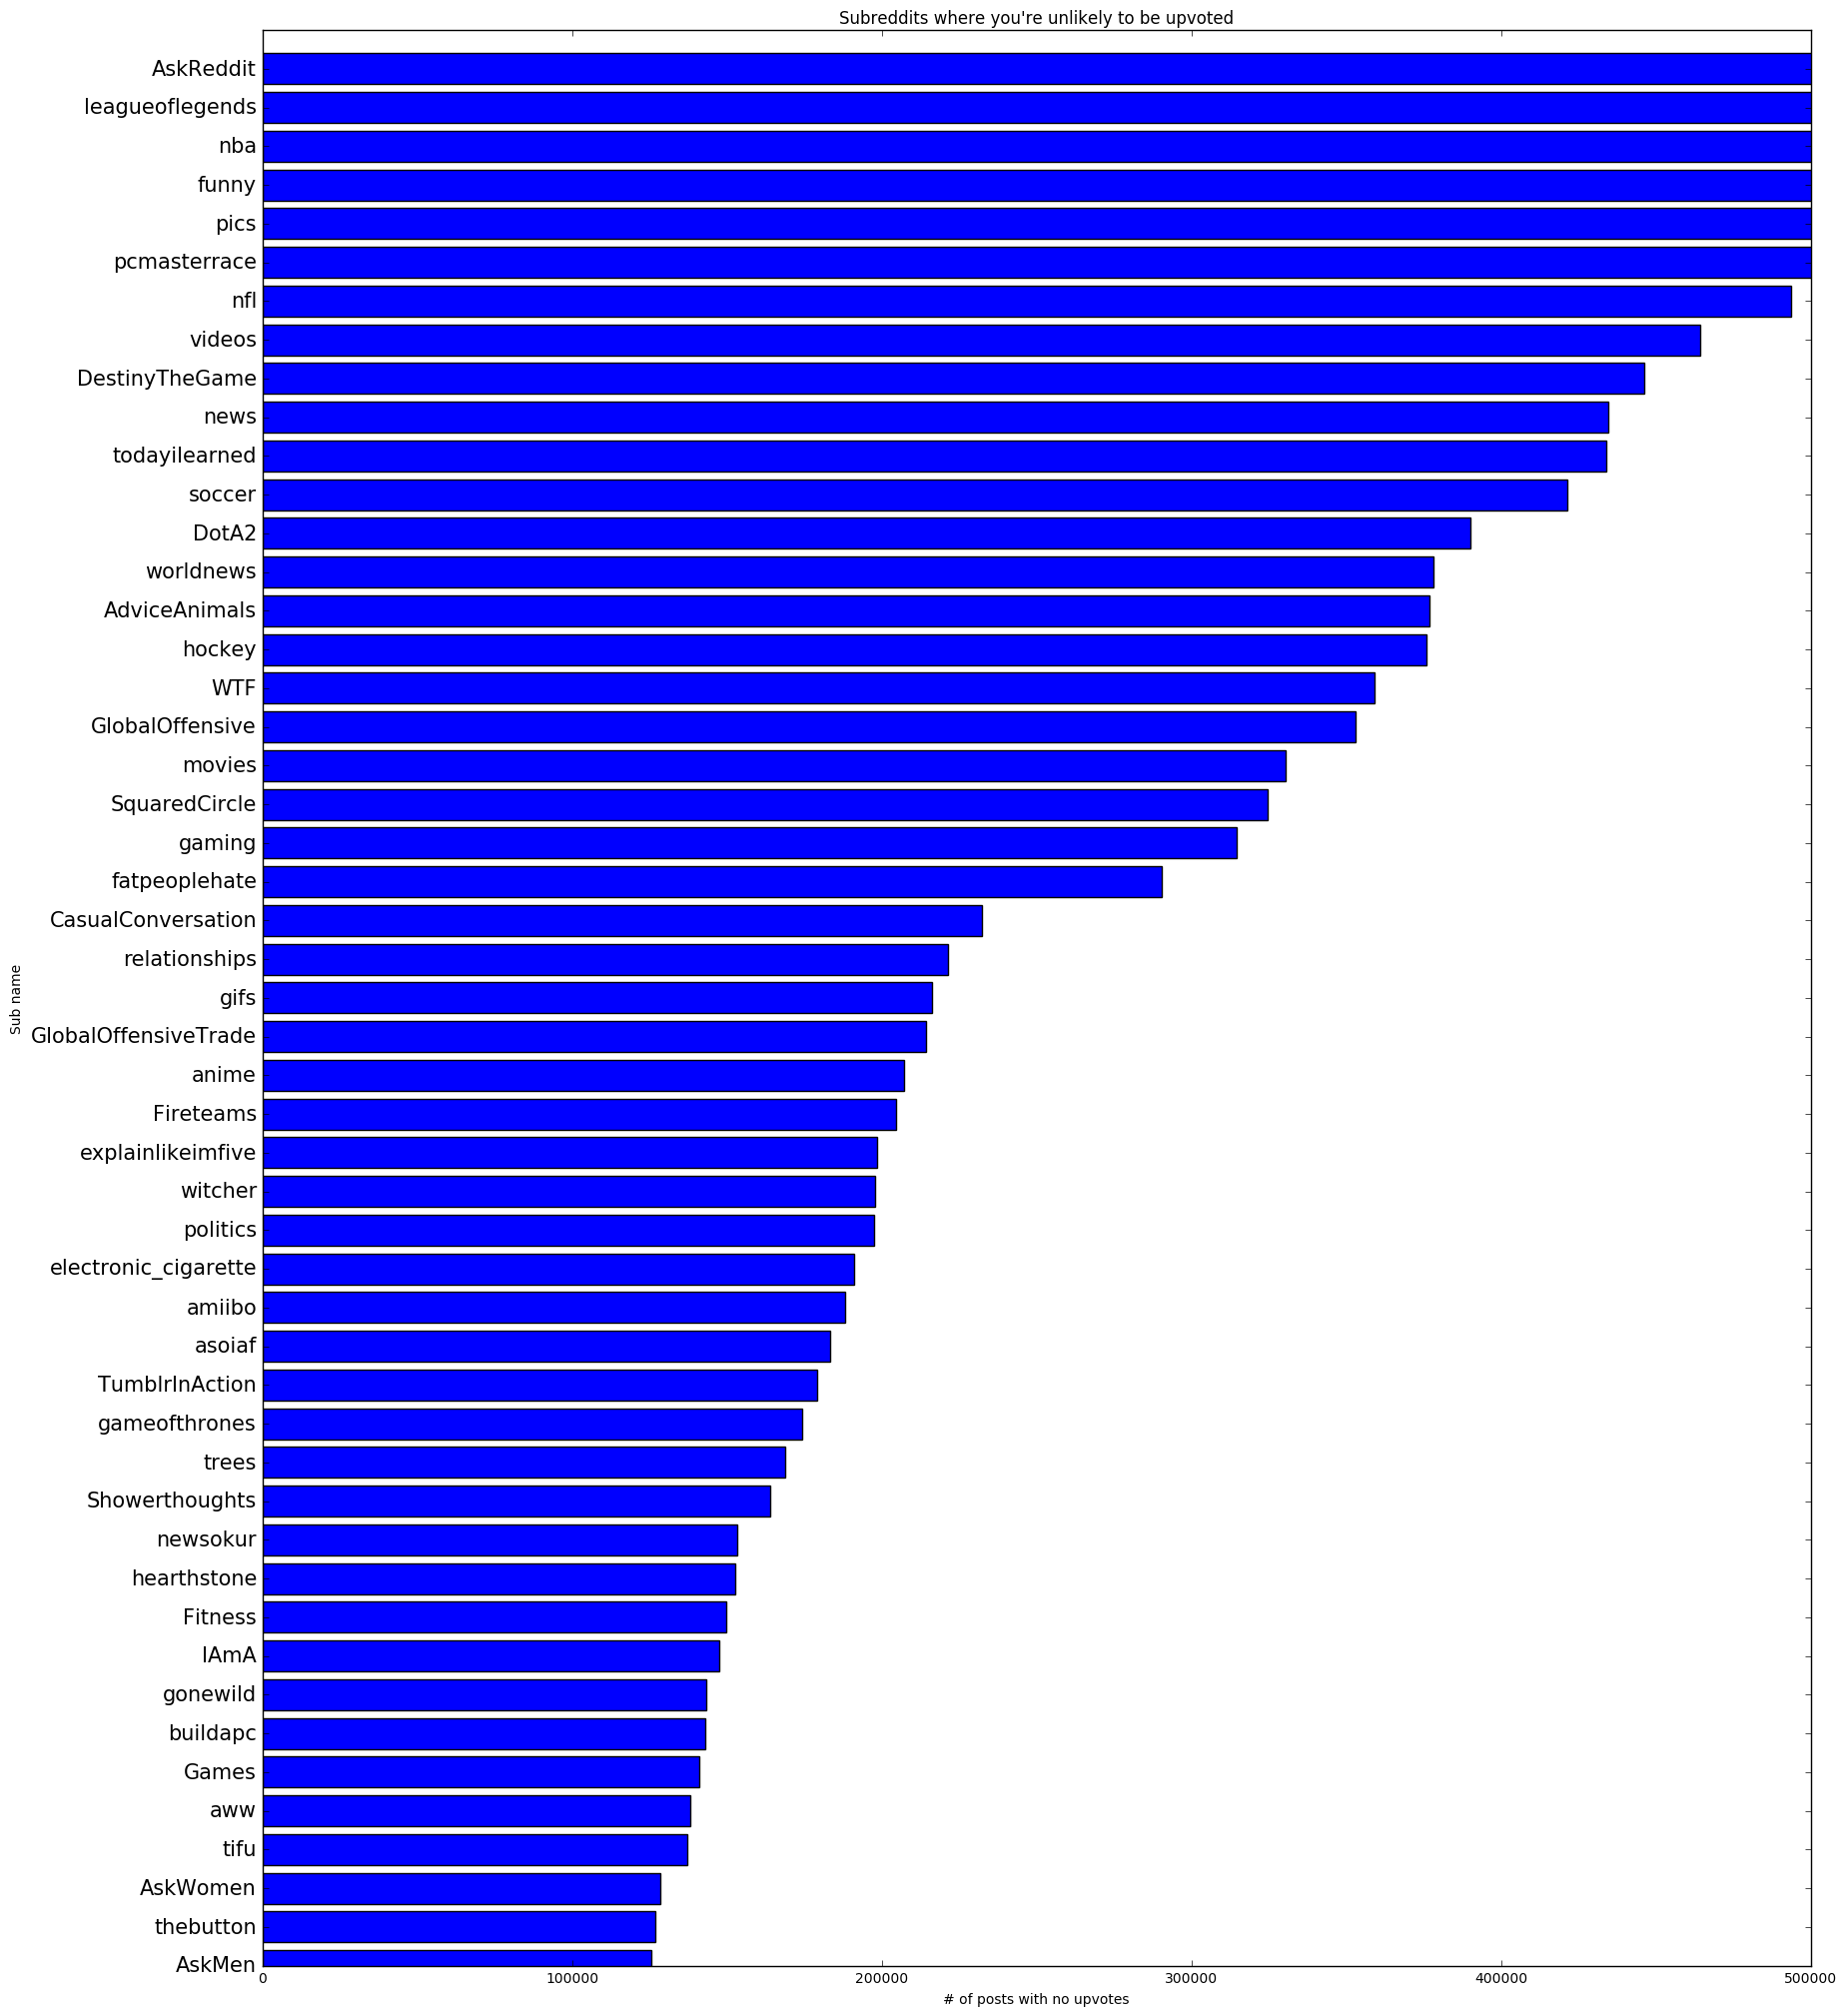
For non-upvoted posts (a score of 1 or 0) this yielded a graph that looked like this:
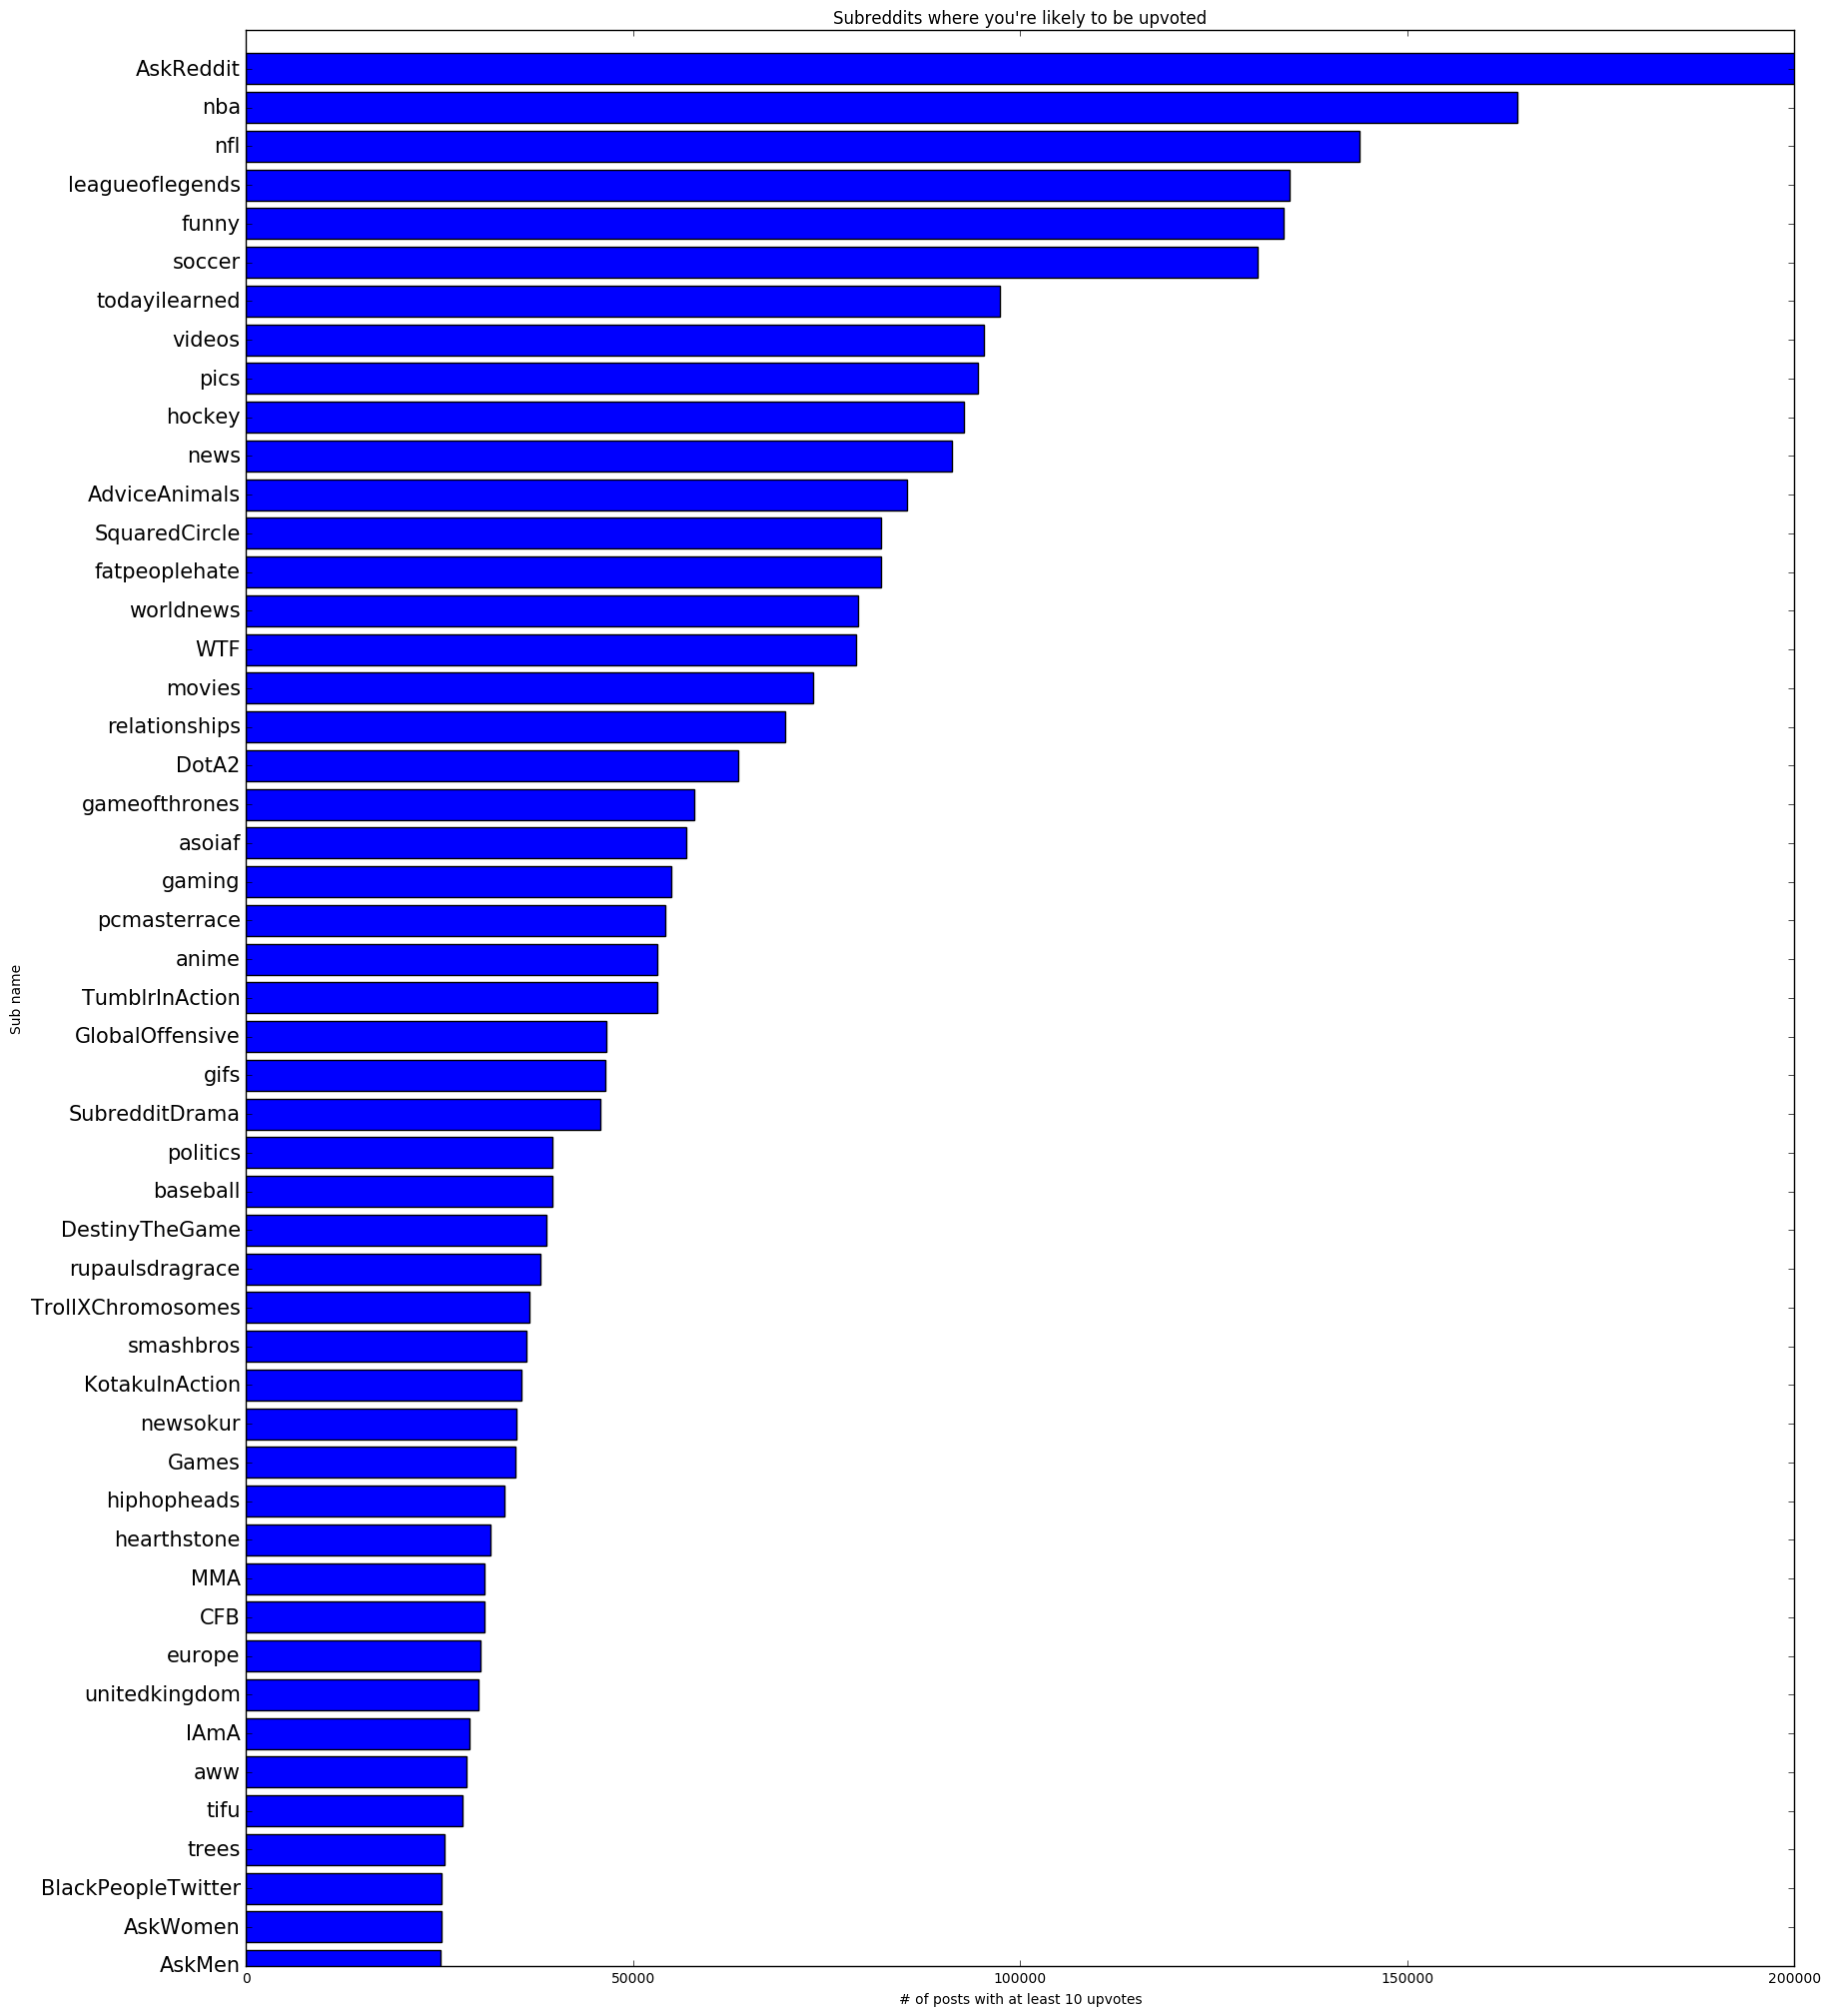
I also generated a graph that used an upvoted threshold of 5+ for good measure. As you can see it looks pretty similar to my 10+ upvoted graph anyway:
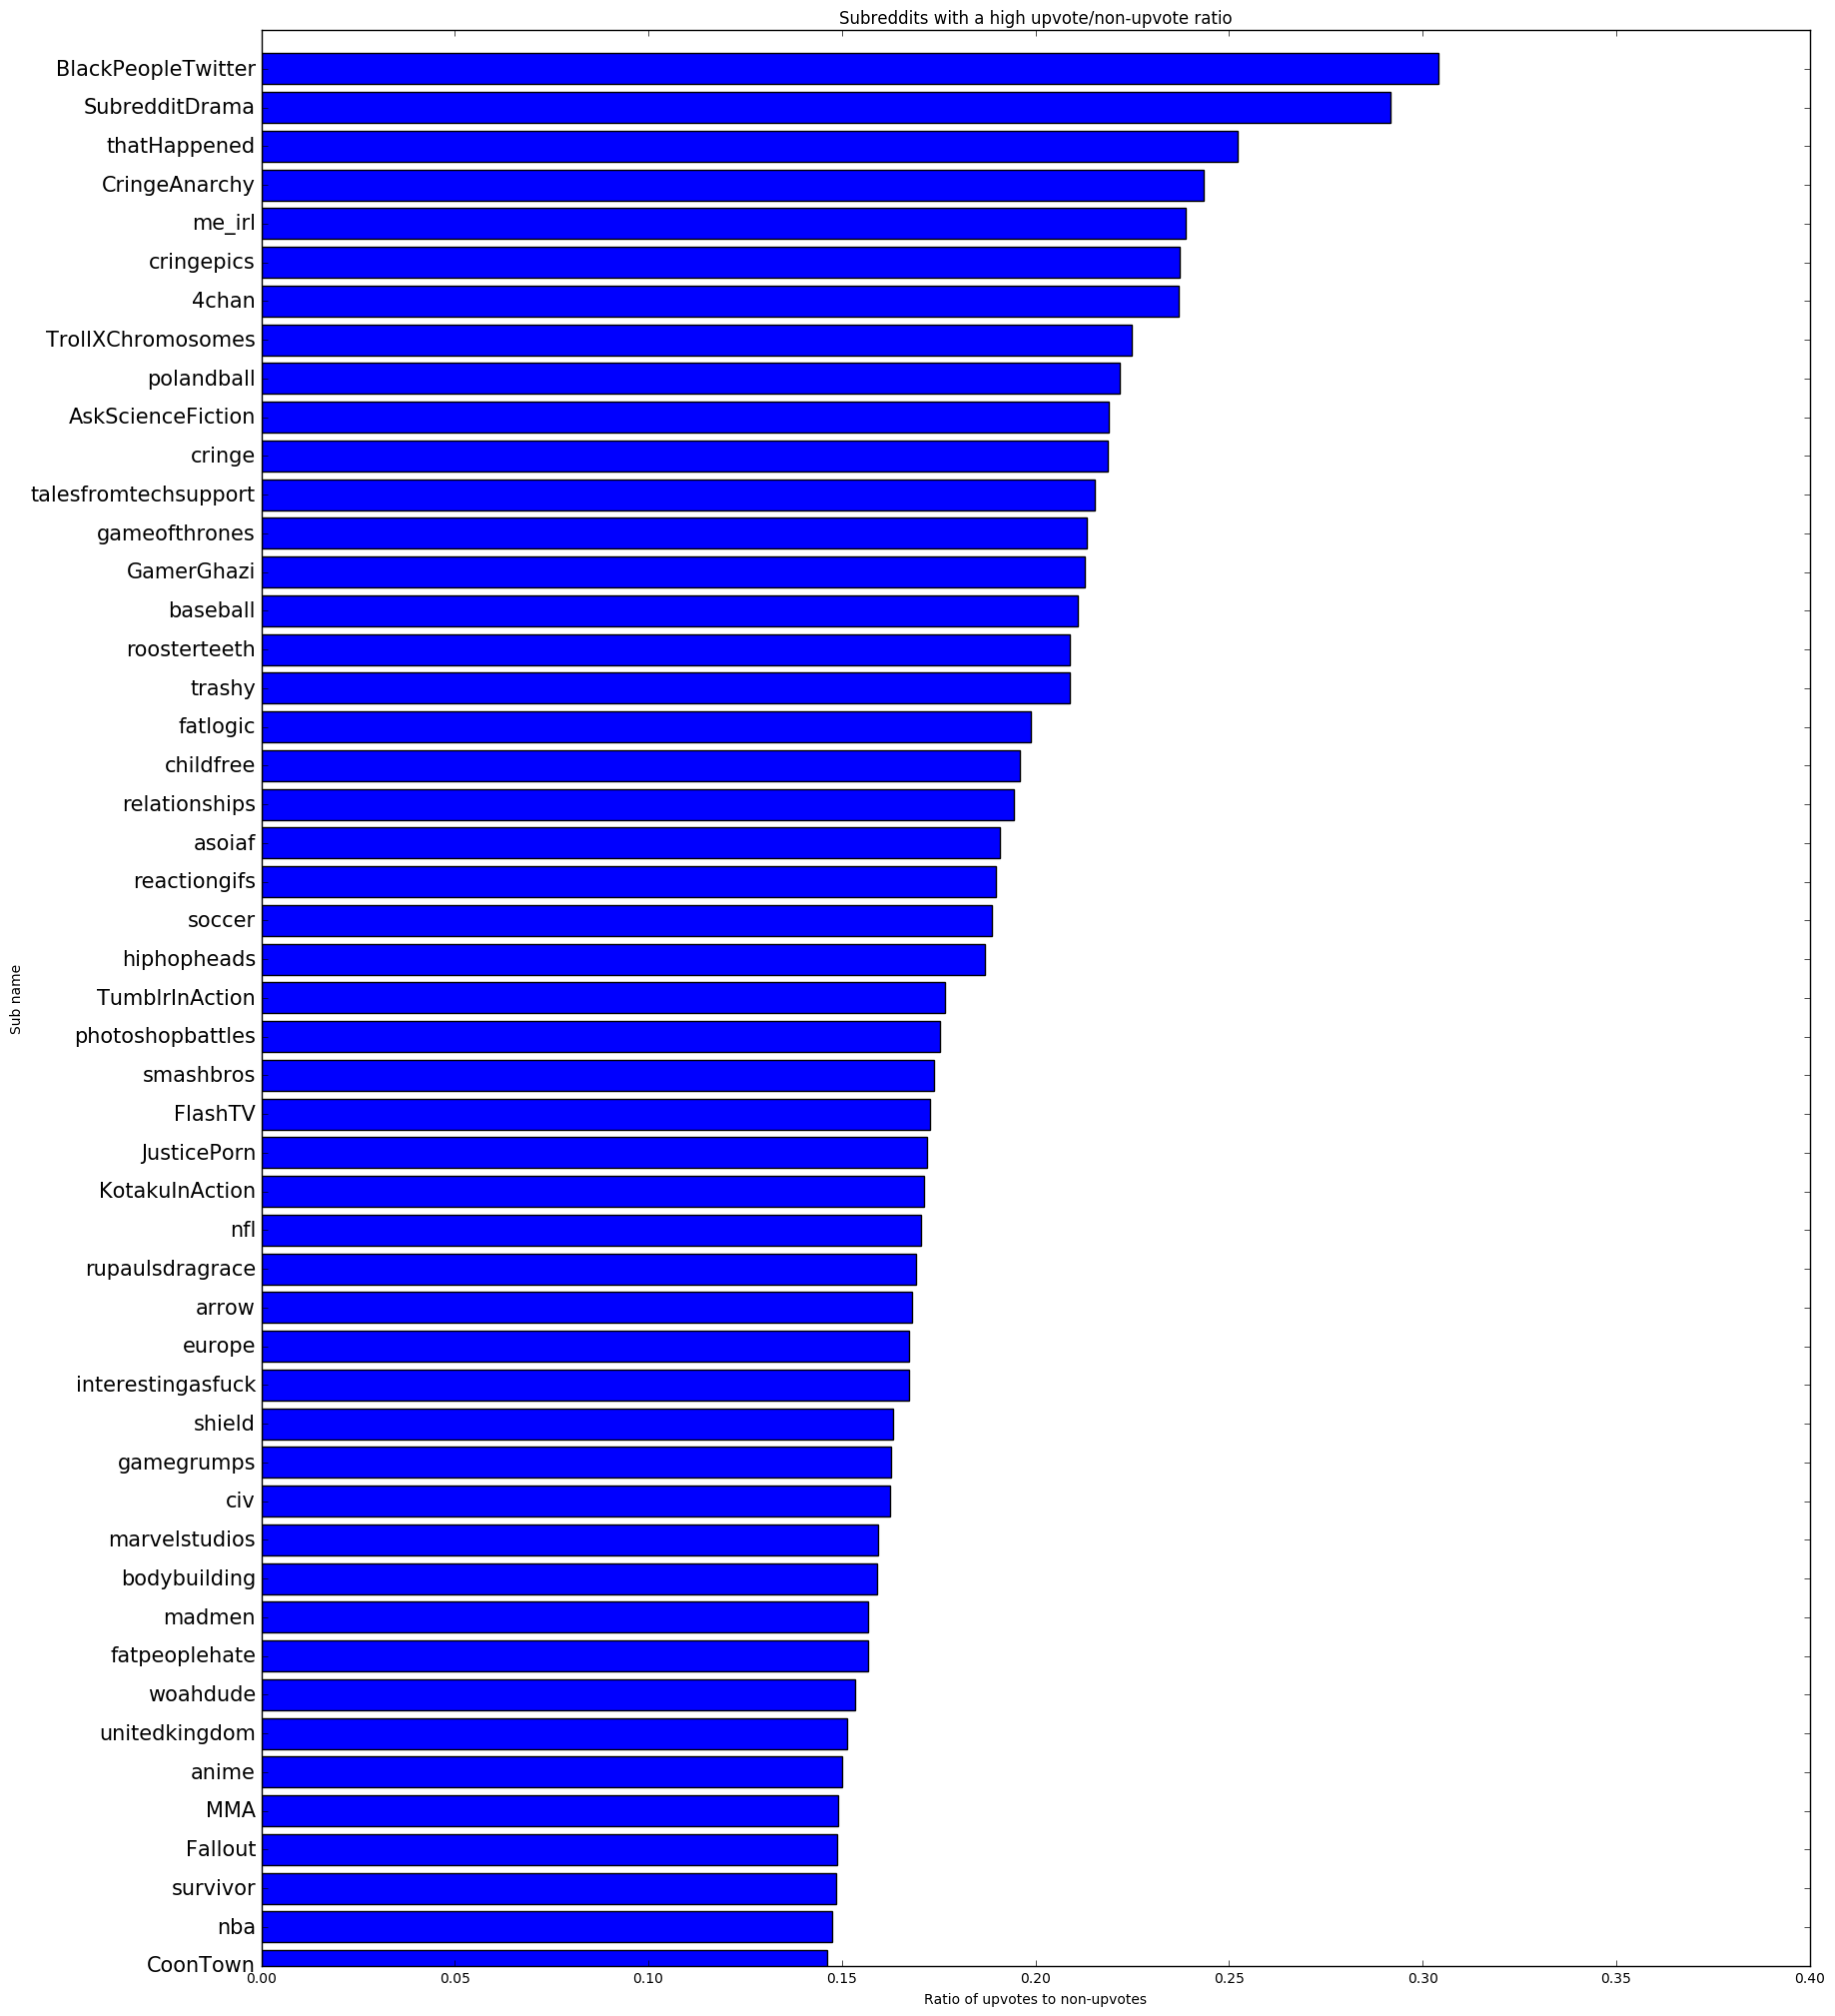
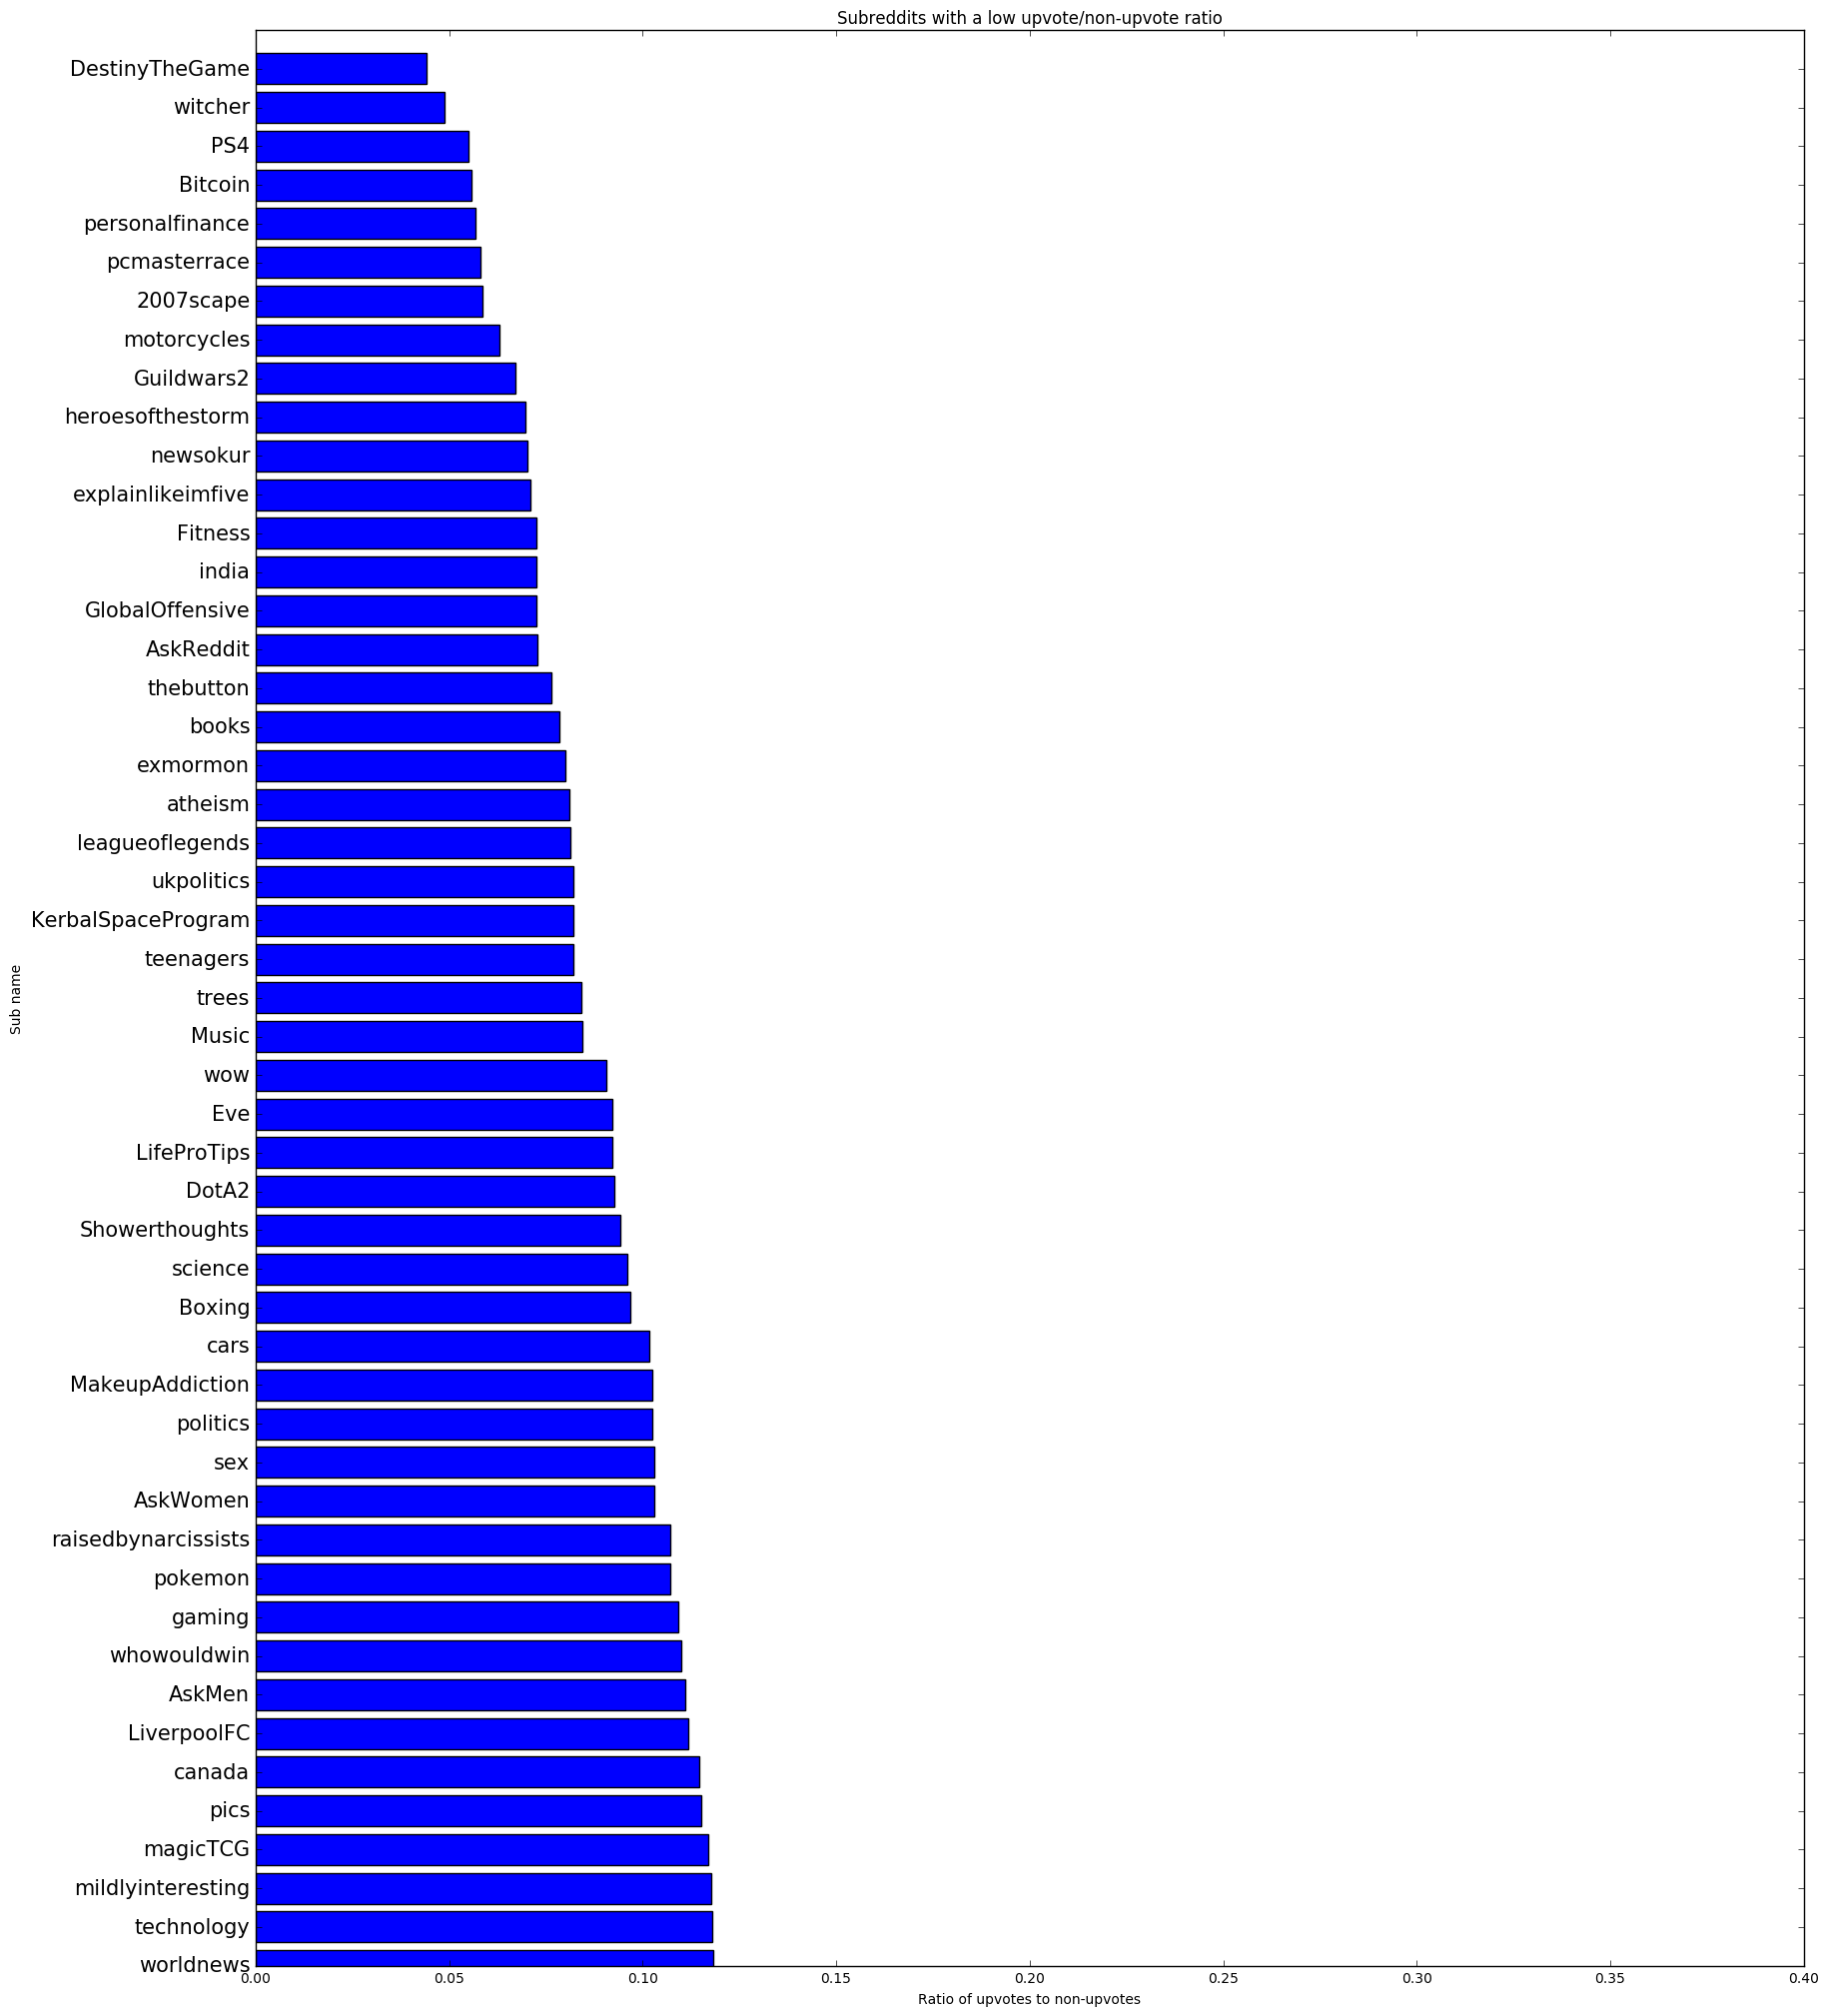
Next, I had to zip together the upvoted dictionary with the downvoted dictionary on each subreddit key. Apparently there is no built-in python function to do this, so I used the code here. Unfortunately the function I used to sort the matplotlib bar chart in descending order produced a list of tuples. Rather than reinventing the wheel I converted the tuple lists into dictionaries and then back into a list of 3-tuples containing the subreddit name, the number of upvoted posts, and the number of non-upvoted posts. Then I converted that list of 3-tuples into a list of 2-tuples with the second value in each tuple being the number of upvoted posts divided by the number of non-upvoted posts, creating the ratios used for the final graph. That was reconverted back into a dictionary to work with my sorting algorithm, which finally produced an ordered list of 2-tuples that was used to make the following graphs:
Insights
- The 'nba', 'nfl', 'soccer', and 'hockey' subreddits all make appearance in the top 15 upvote and non-upvote graphs, but the conspicuously absent 'baseball' is the only sport-oriented subreddit that appears in the top 15 of the high upvote/non-upvote ratio graph. Perhaps because baseball is less popular it also has a tighter, more upvote-prone, community.
- The majority of the subreddits in the 50 most likely to upvote and the 50 least likely to upvote lists are the same because both are correlated to size. That's why an upvote/non-upvote ratio is more useful. There are a few anomalies that are only on one list and not the other such as 'electronic_cigarette', CasualConversation', and 'amiibo'. There seems to be a general societal distaste for electronic cigarettes and amiibos so that sort of makes sense. 'CasualConversation' probably doesn't get as many upvotes because the users there are more concerned with actually talkingn to each other rather than getting internet points.
- Most of the subreddits with a good upvote/non-upvote ratio are silly ('BlackPeopleTwitter', 'me_irl', 'TrollXChromosomes'), circlejerky ('fatlogic', 'childfree', 'TumblrInAction'), TV-show-related ('gameofthrones', 'shield', 'survivor'), or sport-related subreddits ('soccer', 'nfl', 'nba'). People are more prone to upvote silly stuff frivolously and in many of the more circlejerky communities, you don't even have the option to downvote. At first you might be surprised to find that 'CoonTown' made it (barely) into the top 50 subreddits for upvotes, but consider that the people who are part of that community often don't have anywhere else to express their beliefs. I'd categorize them as circlejerky as well. However, it's a little strange to me that the 'europe' and 'unitedkingdom' subreddits made it into the top 50. I'd expect a fairly diverse userbase there ergo not such a consistent upvote ratio.
- Fifteen of the 50 subreddits with the worst upvote/non-upvote ratio are mostly video game-related ('pcmasterrace', '2007scape', 'pokemon') versus just four of the top 50. Then you have some very large and popular subreddits in the bottom 50 ('explainlikeimfive', 'askreddit', 'pics') but I think that's mainly an artifact of so many people making posts that only a small portion of them gain any traction. Strangely, the only two country-based subreddits in the bottom 50 are 'India' and 'canada'. These are relatively small subreddits so the only conclusion is that the people there are less likely to upvote. You have a few larger politically oriented subreddits in the bottom 50 ('ukpolitics', 'politics', 'worldnews') as well as a few smaller very specific hobby oriented subreddits ('Bitcoin', 'motorcycles', 'magicTCG'). Political subreddits are intrinsically full of vitriol and people who get very into their niche hobbies tend to not take too kindly to newcomers. I suspect the users of 'raisedbynarcissists' aren't the type to upvote frivolously either. The only on in the bottom 50 I don't have a good explanation for is 'newsokur', a Japanese news subreddit.
Additional details explained
First let me justify that convoluted converting between tuples and dictionaries several times. Just plugging in these conversions and using other people's code saved me a bit of time versus just coding a new set of functions from scratch. It's a little computationally inefficient but the bottleneck is retrieving the data from the SQLite database anyway. All in all it was a better use of my time to code the way I did.
It was frustratingn not having actual downvote data. The score value I ended up using is the sum of all the upvotes and downvotes a comment received. This means that some of my "non-upvoted" data was actually equally upvoted and downvoted posts. Sadly there's no way to control for that, another reason why I went with the "tally every comment that meets a threshold" strategy.
I played around with different amounts of data analyzed, and it did change my results dramatically. There's over a terabyte of data available and I didn't even use 8GB. It'd be interesting to run this analysis on the complete data set one day.